A server room, or more explicitly the servers in a server room, need to be kept at a low temperature to avoid ageing of certain components.
The rapidly increasing cost for air cooling increase the importance of minimizing electrical cost while maintaining a fairly constant, low temperature.
Standard server room
Normally a server room simply has a split AC unit, cooling the air inside the room. The air gets heated by the server (rack) and is then cooled down to e.g 20C.
The air conditioner will have to run its compressor constantly.

Low cost cooling
The split AC is sometimes replaced with a "portable AC" unit, blowing out cool air to the front and hot/humid air trough a hose (typically simply hanging out of a window). Such a unit typically has lower installation cost (it does not need a licensed electrician or cooling technician) but the exhaust air need to be vented (and possibly condensed water need to be drained). Since air is being blown out of the room, air also need to be sucked in to the server room from the outside, making it less efficient if the outside air is warm.
For a small/medium unit the difference between the compressor running or not can be something like 900W compared to 50W (50W with an internal fan running but not the compressor).
+ Low cost installation
+ Easy/fast to replace in case of failure
- Less efficient cooling in hot outside temperatures

Making use of the outside air
In Sweden the outside air is often cold, even the "south" part temperatures are below 10C in the winter. So why not make use of the outside air to cool the servers?
In this example, outside air is sucked in trough an air inlet in the ceiling, just in front of the server rack. If we have a "floor AC / Portable AC" the air will be sucked in here primary in summer time (hot outside air), so avoid having the inlet in direct sunlight.

In this case, if the AC setpoint is e.g 20C, the AC will run if the outside temperature is high, and probably even if the outside temperature is low.
Simply having an air inlet will not do the trick in the winter time. Cold air will be sucked in by the AC, but the AC fan is most probably small and, in a worst case, the fan will not run if the compressor is not running. We can therefore add a "main exhaust fan", behind the server rack, which blows the heated air outside of the server room.

If the AC setpoint is 20C, the AC will turn off when the outside temperature falls far enough to keep the room cold. But if the outside temperature goes up again, we need to turn off the exhaust fan to not pull in too much hot outside air. A thermostat turning off the fan at high outside temperatures would be a minimum, e.g:
FAN_ON = if (To < 16)
In winter time, we can instead in principle let the inside temperature Ta follow the outside temperature To by the condition:
FAN_ON = if ( Ta > To )
This condition need at least two temperature sensors. We'd also like to monitor the temperatures, possibly send warnings trough email if something seems off.
Combined with the AC unit we would get the behavior below:

It would probably not be best to let the temperature fall below 0C though, so a lower limit of say 12C should be set. The fan condition would be
FAN_ON = if ( Ta > To ) && ( Ta > 12 )

The TSTR04
While looking for a solution I stumbled on this relay board from TinySine. Since there are a lot of powerful servers nearby it seems wrong to add another complex solution with a raspberry Pi or similar. The TSTR04 is directly connected to the USB port of one of the servers, which will be able to power the four on board relays directly. The TSTR04 has four (waterproof) temperature sensors (bought separately), and can be programmed to work in automatic thermostat mode or manually controlled from the USB port.
The USB connection is a normal VCP (Virtual Com port) at 9600 Bps, 8N1. Commands sent is used to update setpoints and turn on or off the relays.

VCP Serial port commands (9600, 8N1):
A Set Auto mode
B Set Manual mode
C Get working mode
D Get state: 9 bytes, relay + temp
O Set ch 1 threshold: MSB+LSB(ON)+MSB+LSB(OFF)
P Set ch 2 threshold: MSB+LSB(ON)+MSB+LSB(OFF)
Q Set ch 3 threshold: MSB+LSB(ON)+MSB+LSB(OFF)
R Set ch 4 threshold: MSB+LSB(ON)+MSB+LSB(OFF)
S Set ch 5 threshold: MSB+LSB(ON)+MSB+LSB(OFF)
T Set ch 6 threshold: MSB+LSB(ON)+MSB+LSB(OFF)
U Set ch 7 threshold: MSB+LSB(ON)+MSB+LSB(OFF)
V Set ch 8 threshold: MSB+LSB(ON)+MSB+LSB(OFF)
Z Get version, 2 bytes. Module ID (15) + sw version
[ Get relay states (1 byte)
\ Set relay states, 255=all on
d All relays to pos 1
e Relay 1 to pos 1
f Relay 2 to pos 1
g Relay 3 to pos 1
h Relay 4 to pos 1
i Relay 5 to pos 1
j Relay 6 to pos 1
k Relay 7 to pos 1
l Relay 8 to pos 1
n All relays to pos 0
o Relay 1 to pos 0
p Relay 2 to pos 0
q Relay 3 to pos 0
r Relay 4 to pos 0
s Relay 5 to pos 0
t Relay 6 to pos 0
u Relay 7 to pos 0
v Relay 8 to pos 0
Worth to note about the TSTR04:
- It will restart when the serial port is opened (Windows). Start-up time is approximate 5s, during which it will not respond to commands. This makes it cumbersome to create a script running periodically from e.g cron.
- The thermostat function (Auto mode) only works for heating, i.e TOFF>TON. But the relays are SPDT so it can still be configured for cooling.
- When using the thermostat function (Auto mode), the relay will not turn on if started in the hysteresis band. E.g if Ton=15C, Toff=30C the relay will not activate if the board is started at 20C. This is by design.
- The small display is an OLED type that is known to wear out fast.
- The watertight DS18B20 sensors wire coloring is:
- VCC= Red
- DATA= Yellow
- GND= green
I will not use the "Auto" mode because the condition for relay 1, in my case, involves two sensor readings. In a simpler solution or where you don't want a program running all the time it might be worth using Auto mode though.
Programming the TSTR04 - creating a database for the readings
The goal is here to connect the relay/sensor board to a (Linux) server and let the server control and monitor the temperatures.
We also want some graphs to see how the temperature behave. For this purpose I used rrdtool. First install the rrdtool support in Linux:
apt-get install rrdtool python-rrdtool librrd-dev
pip3 install rrdtool
... and create the database (run the script below):
#!/bin/bash

# ----- Create rrd for the rack sensors (TSTR04)

XDBXFILE=/var/log/temp_rack.rrd
if [ ! -f "$XDBXFILE" ]; then
#
# Step 2.5m (150s)         -> 1d = 24*60*60/150= 576 steps
# heartbeat: 3m (180s)
#
#

#
# DS:temp1:GAUGE:180:-30:50
#                 ^   ^   ^_____ MAX
#                 |    |________ MIN
#                 |_____________ Heartbeat
#
#
# Graph width = 800pixels
#
# RRA:LAST:0.5:150:7d \
#          ^   ^   ^_____ Range (step size=150 -> 4032 steps)
#          |   |_________ Step size
#          |_____________ Unknown data treatment: 0.5 means {1,unknown,unknown,1} results in 1
#
    /usr/bin/rrdtool create "$XDBXFILE" \
--step 150s \
DS:temp1:GAUGE:180:-30:50 \
DS:temp2:GAUGE:180:-30:50 \
DS:temp3:GAUGE:180:-30:50 \
DS:temp4:GAUGE:180:-30:50 \
RRA:LAST:0.5:150s:7d \
RRA:AVERAGE:0.5:1d:10y \
RRA:MIN:0.5:1d:10y \
RRA:MAX:0.5:1d:10y

fi
The database above will be relatively small, only 472kByte, and store years of temperature data.
When the database is created we can continue with a program that control the relay and feed the database.
Programming the TSTR04 - updating measurements and control the fan
Since we need a condition from two sensors to activate the fan relay, the TSTR04 will be controlled "manually" from the server.
The Python3 code below will measure each second and (possibly) change the relay state each minute (to save the relay and fan from wear). Data is saved with 150s intervals to an rrd.
# -*- coding: utf-8 -*-
#
# Installation:
# -------------
# Linux:
#  apt-get install rrdtool python-rrdtool librrd-dev
#  pip3 install rrdtool
#
# Then create the database (see separate script).
#
# Windows:
#  Install Python 3.7.9 for all users from https://www.python.org/downloads/
#  Go to C:\Program Files\Python37\Scripts,
#  .\pip uninstall serial
#  .\pip install pyserial
#
import rrdtool
import time
from time import sleep
import serial

TSTRSerialPortName="/dev/ttyUSB2"

def print_hex_list(data):
 print ('[{}]'.format(', '.join("0x%02x"%x for x in data)),end='')

def sbin(num):
 global b
 if(num > 1):
 sbin(num // 2)
 b=b+str(num % 2)

def Print_bin(n):
 global b
 b=""
 sbin(n)
 b="00000000"+b
 b=b[-8:]
 print (b)


def TSTR_ask(s):
 serportTSTR.reset_input_buffer()
 serportTSTR.write(bytes(s,'utf-8'))
 r=serportTSTR.read_until()
 return (r)

def TSTR_askfor(s,n):
 serportTSTR.reset_input_buffer()
 serportTSTR.write(bytes(s,'utf-8'))
 r=serportTSTR.read(n)
 return (r)

def Temp_Get():
 t={}
 v=TSTR_askfor('D',9)

 t[0]= (0.0625*int.from_bytes(v[1:3], "little", signed="True"))
 t[1]= (0.0625*int.from_bytes(v[3:5], "little", signed="True"))
 t[2]= (0.0625*int.from_bytes(v[5:7], "little", signed="True"))
 t[3]= (0.0625*int.from_bytes(v[7:9], "little", signed="True"))
 return t,v[0]

# Temp_SetMode(0): Auto
# Temp_SetMode(1): Manual
def Temp_SetMode(m):
 serportTSTR.write((b'A'[0]+m).to_bytes(1,'big'))

def Temp_GetMode():
 return int.from_bytes(TSTR_askfor('C',1),'big')-65


# E.g Temp_Set(3,24,25) # Ch 3 turns on at 24C, heating to 25C then turns off.
def Temp_Set(ch,Ton,Toff):
 c=b'O'[0]+ch
 tion=int(Ton/0.0625)
 tioff=int(Toff/0.0625)
 tion_lo=tion & 0xff
 tion_hi=(tion & 0xff00) >>8
 tioff_lo=tioff & 0xff
 tioff_hi=(tioff & 0xff00) >>8
 tx=[c,tion_lo,tion_hi,tioff_lo,tioff_hi]
 b=bytes(bytearray(tx))
 print (b)
 serportTSTR.write(b)

def Relay_Set(r,s):
 if (s):
  serportTSTR.write((b'e'[0]+r).to_bytes(1,'big'))
 else:
  serportTSTR.write((b'o'[0]+r).to_bytes(1,'big'))

def Relay_AllOn():
 serportTSTR.write(b'd')

def Relay_AllOff():
 serportTSTR.write(b'n')

if __name__ == "__main__":
 serportTSTR=serial.Serial(
 port=TSTRSerialPortName,
 baudrate=9600,
 bytesize=8,
 timeout=1,
 stopbits=serial.STOPBITS_ONE) # Open com port

 v=TSTR_ask('C')
 print ("Starting...")
 time.sleep(4)         # Wait for the TSTR04 to start up/show the flashy logo

 serportTSTR.timeout=1

 print ("Version:",end='')
 v=TSTR_askfor('Z',2)
 print_hex_list(v)
 print ("")

 Temp_SetMode(1) # Manual mode
 Relay_AllOff()  # Turn off all relays

 ticks=0
 ticks_relay=0


 while (1):
        t,r=Temp_Get()
        for i in range(0,4):
            print (str(ticks).zfill(4)+": T"+str(i)+": "+str(t[i]))
        print (str(ticks).zfill(4)+": Relay:",end="")
        Print_bin(r)

        if (ticks_relay>=60):
            ticks_relay=0
            # Ch0=Outside temp
            # Ch1=Server rack backside temp
            # Ch2=Server rack front temp
            if (t[2]>12) and (t[0]<t[2]):
                Relay_Set(0,1)  # Turn on cooling if front temp >12 and outside < front
            else:
                Relay_Set(0,0)

        # Update RRD each 150s:
        if (ticks>=150):
            ticks=0
            print ('N:'+str(t[0])+":"+str(t[1])+":"+str(t[2])+":"+str(t[3]))
            rrdtool.update('/var/log/temp_rack.rrd', 'N:'+str(t[0])+":"+str(t[1])+":"+str(t[2])+":"+str(t[3]))

        time.sleep(1)
        ticks +=1
        ticks_relay +=1

 serportTSTR.close
Note: if this script is not executed by root, you will have to add the user to the "dialout" group to be able to access /dev/ttyUSB2. You will also make sure the database file can be written by the user running the script.
Typical output:
NB:
- T0= To (Outside temp)
- T1= Te (Rack backside/air out temp)
- T2= Ta (Rack front side/air in temp)
- T3= Somewhere else (side)
j2admin@z590a:~/src/temp$ python3 tstr.py
Starting...
Version:[0x0f, 0x02]
000: T0: 12.125
001: T1: 23.125
002: T2: 16.1875
003: T3: 20.5625
004: Relay:0000
005: T0: 12.1875
006: T1: 23.1875
007: T2: 16.3125
008: T3: 20.5
009: Relay:0001
010: T0: 12.1875
011: T1: 23.1875
012: T2: 16.3125
013: T3: 20.5
014: Relay:0001

... and so on...
Generating graphs for a web page
The script below will generate png pictures for daily, weekly and yearly temperatures. You will have to modify the target directory of each picture so you can view it from the web server (apache, nginx).
This script should be called from the web page, so the graphs will be updated when accessed. You could also put it in a cron job, updating it each 5m or so, but if nobody is looking it might be better to save the cpu power.
rack_generate_graphs.sh:
#!/bin/bash

XDB=/var/log/temp_rack.rrd
XDT=/var/www/lan/html/temps/rack_daily-temperature.png

XWT=/var/www/lan/html/temps/rack_weekly-temperatures.png
XYT0=/var/www/lan/html/temps/rack_yearly-temperature_outside.png
XYT1=/var/www/lan/html/temps/rack_yearly-temperature_rear.png
XYT2=/var/www/lan/html/temps/rack_yearly-temperature_front.png
XYT3=/var/www/lan/html/temps/rack_yearly-temperature_side.png

#       --lazy \
/usr/bin/rrdtool graph ${XDT} \
        -a PNG \
        -h 200 -w 800 \
        -s -1d -l 20 \
        -v 'Temperature (C)' \
        -t 'Daily Temperature' \
        -x 'HOUR:1:HOUR:3:HOUR:3:0:%b %d %H:00' \
        --font "LEGEND:8:Courier New" \
        DEF:temp1=${XDB}:temp1:AVERAGE \
        DEF:temp2=${XDB}:temp2:AVERAGE \
        DEF:temp3=${XDB}:temp3:AVERAGE \
        DEF:temp4=${XDB}:temp4:AVERAGE \
        LINE2:temp1#9ff9e7:"Outside        " \
        LINE2:temp2#7a8535:"Rear           " \
        LINE2:temp3#2ac535:"Front          " \
        LINE2:temp4#c90a6a:"Side\\n" >/dev/null \
        GPRINT:temp1:MAX:"Max\: % 6.2lf °C" \
        GPRINT:temp2:MAX:"   Max\: %6.2lf °C" \
        GPRINT:temp3:MAX:"   Max\: %6.2lf °C" \
        GPRINT:temp4:MAX:"   Max\: %6.2lf °C\\n" \
        GPRINT:temp1:MIN:"Min\: %6.2lf °C" \
        GPRINT:temp2:MIN:"   Min\: %6.2lf °C" \
        GPRINT:temp3:MIN:"   Min\: %6.2lf °C" \
        GPRINT:temp4:MIN:"   Min\: %6.2lf °C\\n" \
        GPRINT:temp1:LAST:"Last\:%6.2lf °C" \
        GPRINT:temp2:LAST:"   Last\:%6.2lf °C" \
        GPRINT:temp3:LAST:"   Last\:%6.2lf °C" \
        GPRINT:temp4:LAST:"   Last\:%6.2lf °C\\n" \
        COMMENT:"  "


/usr/bin/rrdtool graph ${XWT} \
        -a PNG \
        -h 200 -w 800 \
        -v 'Temperature (C)' \
        -t 'Weekly Temperatures' \
        -x 'HOUR:6:DAY:1:DAY:1:86400:%a' \
        -s -1w \
        DEF:temp1=${XDB}:temp1:AVERAGE \
        DEF:temp2=${XDB}:temp2:AVERAGE \
        DEF:temp3=${XDB}:temp3:AVERAGE \
        DEF:temp4=${XDB}:temp4:AVERAGE \
        LINE2:temp1#9ff9e7:"Outside        " \
        LINE2:temp2#7a8535:"Rear           " \
        LINE2:temp3#2ac535:"Front          " \
        LINE2:temp4#c90a6a:"Side\\n"  >/dev/null \
        GPRINT:temp1:MAX:"Max\: % 6.2lf °C" \
        GPRINT:temp2:MAX:"   Max\: %6.2lf °C" \
        GPRINT:temp3:MAX:"   Max\: %6.2lf °C" \
        GPRINT:temp4:MAX:"   Max\: %6.2lf °C\\n" \
        GPRINT:temp1:MIN:"Min\: %6.2lf °C" \
        GPRINT:temp2:MIN:"   Min\: %6.2lf °C" \
        GPRINT:temp3:MIN:"   Min\: %6.2lf °C" \
        GPRINT:temp4:MIN:"   Min\: %6.2lf °C\\n" \
        GPRINT:temp1:LAST:"Last\:%6.2lf °C" \
        GPRINT:temp2:LAST:"   Last\:%6.2lf °C" \
        GPRINT:temp3:LAST:"   Last\:%6.2lf °C" \
        GPRINT:temp4:LAST:"   Last\:%6.2lf °C\\n" \
        COMMENT:"  "


/usr/bin/rrdtool graph ${XYT0} \
        -a PNG \
        -h 200 -w 800 \
        -v 'Temperature (C)' \
        -t 'Yearly Outside Temperature' \
        -x 'DAY:7:MONTH:1:MONTH:1:0:%b' \
        -s -1y \
        DEF:tempmin=${XDB}:temp1:MIN \
        DEF:tempmax=${XDB}:temp1:MAX \
        DEF:tempavg=${XDB}:temp1:AVERAGE \
        LINE3:tempmax#c90a6a:"Max" >/dev/null \
        GPRINT:tempmax:MAX:"\: %4.2lf °C" \
        LINE2:tempmin#1a1af9:"Min" >/dev/null \
        GPRINT:tempmin:MIN:"\: %4.2lf °C" \
        LINE1:tempavg#1afa1a:"Average" >/dev/null \
        GPRINT:tempavg:AVERAGE:"\: %4.2lf °C"

/usr/bin/rrdtool graph ${XYT1} \
        -a PNG \
        -h 200 -w 800 \
        -v 'Temperature (C)' \
        -t 'Yearly Rear Temperature' \
        -x 'DAY:7:MONTH:1:MONTH:1:0:%b' \
        -s -1y \
        DEF:tempmin=${XDB}:temp2:MIN \
        DEF:tempmax=${XDB}:temp2:MAX \
        DEF:tempavg=${XDB}:temp2:AVERAGE \
        LINE3:tempmax#c90a6a:"Max" >/dev/null \
        GPRINT:tempmax:MAX:"\: %4.2lf °C" \
        LINE2:tempmin#1a1af9:"Min" >/dev/null \
        GPRINT:tempmin:MIN:"\: %4.2lf °C" \
        LINE1:tempavg#1afa1a:"Average" >/dev/null \
        GPRINT:tempavg:AVERAGE:"\: %4.2lf °C"


/usr/bin/rrdtool graph ${XYT2} \
        -a PNG \
        -h 200 -w 800 \
        -v 'Temperature (C)' \
        -t 'Yearly Front Temperature' \
        -x 'DAY:7:MONTH:1:MONTH:1:0:%b' \
        -s -1y \
        DEF:tempmin=${XDB}:temp3:MIN \
        DEF:tempmax=${XDB}:temp3:MAX \
        DEF:tempavg=${XDB}:temp3:AVERAGE \
        LINE3:tempmax#c90a6a:"Max" >/dev/null \
        GPRINT:tempmax:MAX:"\: %4.2lf °C" \
        LINE2:tempmin#1a1af9:"Min" >/dev/null \
        GPRINT:tempmin:MIN:"\: %4.2lf °C" \
        LINE1:tempavg#1afa1a:"Average" >/dev/null \
        GPRINT:tempavg:AVERAGE:"\: %4.2lf °C"


/usr/bin/rrdtool graph ${XYT3} \
        -a PNG \
        -h 200 -w 800 \
        -v 'Temperature (C)' \
        -t 'Yearly Side Temperature' \
        -x 'DAY:7:MONTH:1:MONTH:1:0:%b' \
        -s -1y \
        DEF:tempmin=${XDB}:temp4:MIN \
        DEF:tempmax=${XDB}:temp4:MAX \
        DEF:tempavg=${XDB}:temp4:AVERAGE \
        LINE3:tempmax#c90a6a:"Max" >/dev/null \
        GPRINT:tempmax:MAX:"\: %4.2lf °C" \
        LINE2:tempmin#1a1af9:"Min" >/dev/null \
        GPRINT:tempmin:MIN:"\: %4.2lf °C" \
        LINE1:tempavg#1afa1a:"Average" >/dev/null \
        GPRINT:tempavg:AVERAGE:"\: %4.2lf °C"
One of the resulting pictures:
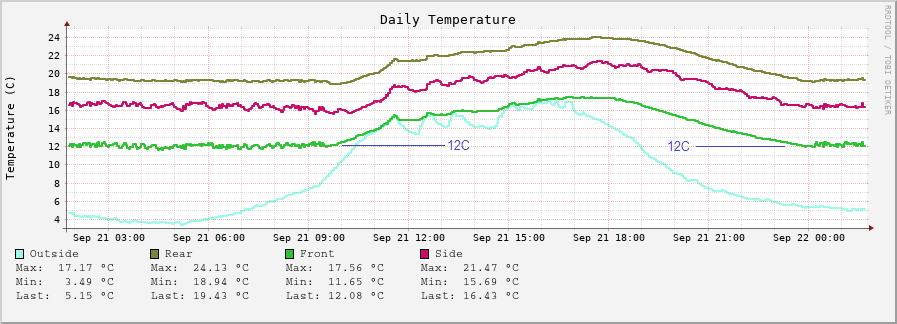
The (blue) mark at 12C shows that the (Front) temperature is regulated by the relay/fan, and not going below 12C. In this case the AC unit would turn on if "Front"/green temperature t[2] went above 20C, cooling the air in front of the rack causing it to be clamped at 20C.
A php script that displays the graphs could look like below.
<!DOCTYPE html>
<html lang="en">
<head>
    <meta charset="UTF-8">
    <meta name="viewport" content="width=device-width, initial-scale=1">
    <title>Rack Graphs</title>
    <link rel="stylesheet" href="/css/bootstrap.css">
    <style type="text/css">
        body{ font: 14px sans-serif; text-align: center; }
    </style>
</head>
<body>
    <div class="page-header">
        <h3>Rack Graphs</h3>
    </div>


<p><div class="container-fluid">
<?php
header ("Pragma-directive: no-cache");
header ("Cache-directive: no-cache");
header ("Cache-control: no-cache");
header ("Pragma: no-cache");
header ("Expires: 0");

$cmd="sudo /var/www/lan/sh/temps/rack_generate_graphs.sh";

header('X-Accel-Buffering: no');

while (@ ob_end_flush()); // end all output buffers if any

$proc = popen($cmd, 'r');
while (!feof($proc))
{
    echo fread($proc, 4096);
    @ flush();
}

echo '
<P>
<IMG SRC="/temps/rack_daily-temperature.png?dummy=' . rand() . ' ">
</P>
<P>
<IMG SRC="/temps/rack_weekly-temperatures.png?dummy=' . rand() . ' ">
</P>
<P>
<IMG SRC="/temps/rack_yearly-temperature_outside.png?dummy=' . rand() . ' ">
</P>
<P>
<IMG SRC="/temps/rack_yearly-temperature_rear.png?dummy=' . rand() . ' ">
</P>
<P>
<IMG SRC="/temps/rack_yearly-temperature_front.png?dummy=' . rand() . ' ">
</P>
<P>
<IMG SRC="/temps/rack_yearly-temperature_side.png?dummy=' . rand() . ' ">
</P>
';
?>

</div>
</p>

</body>
</html>
The "?dummy=(randomized number)" above is to avoid caching of the pictures (in android phones/chrome).
Note that I use sudo to call the actual script that generate the pictures. You could possibly give the www-data group rights to execute the script instead. If you use sudo, you need to add a line in /etc/sudoers like this:
www-data ALL = NOPASSWD:/var/www/lan/sh/temps/rack_generate_graphs.sh